Weather Dial
Description
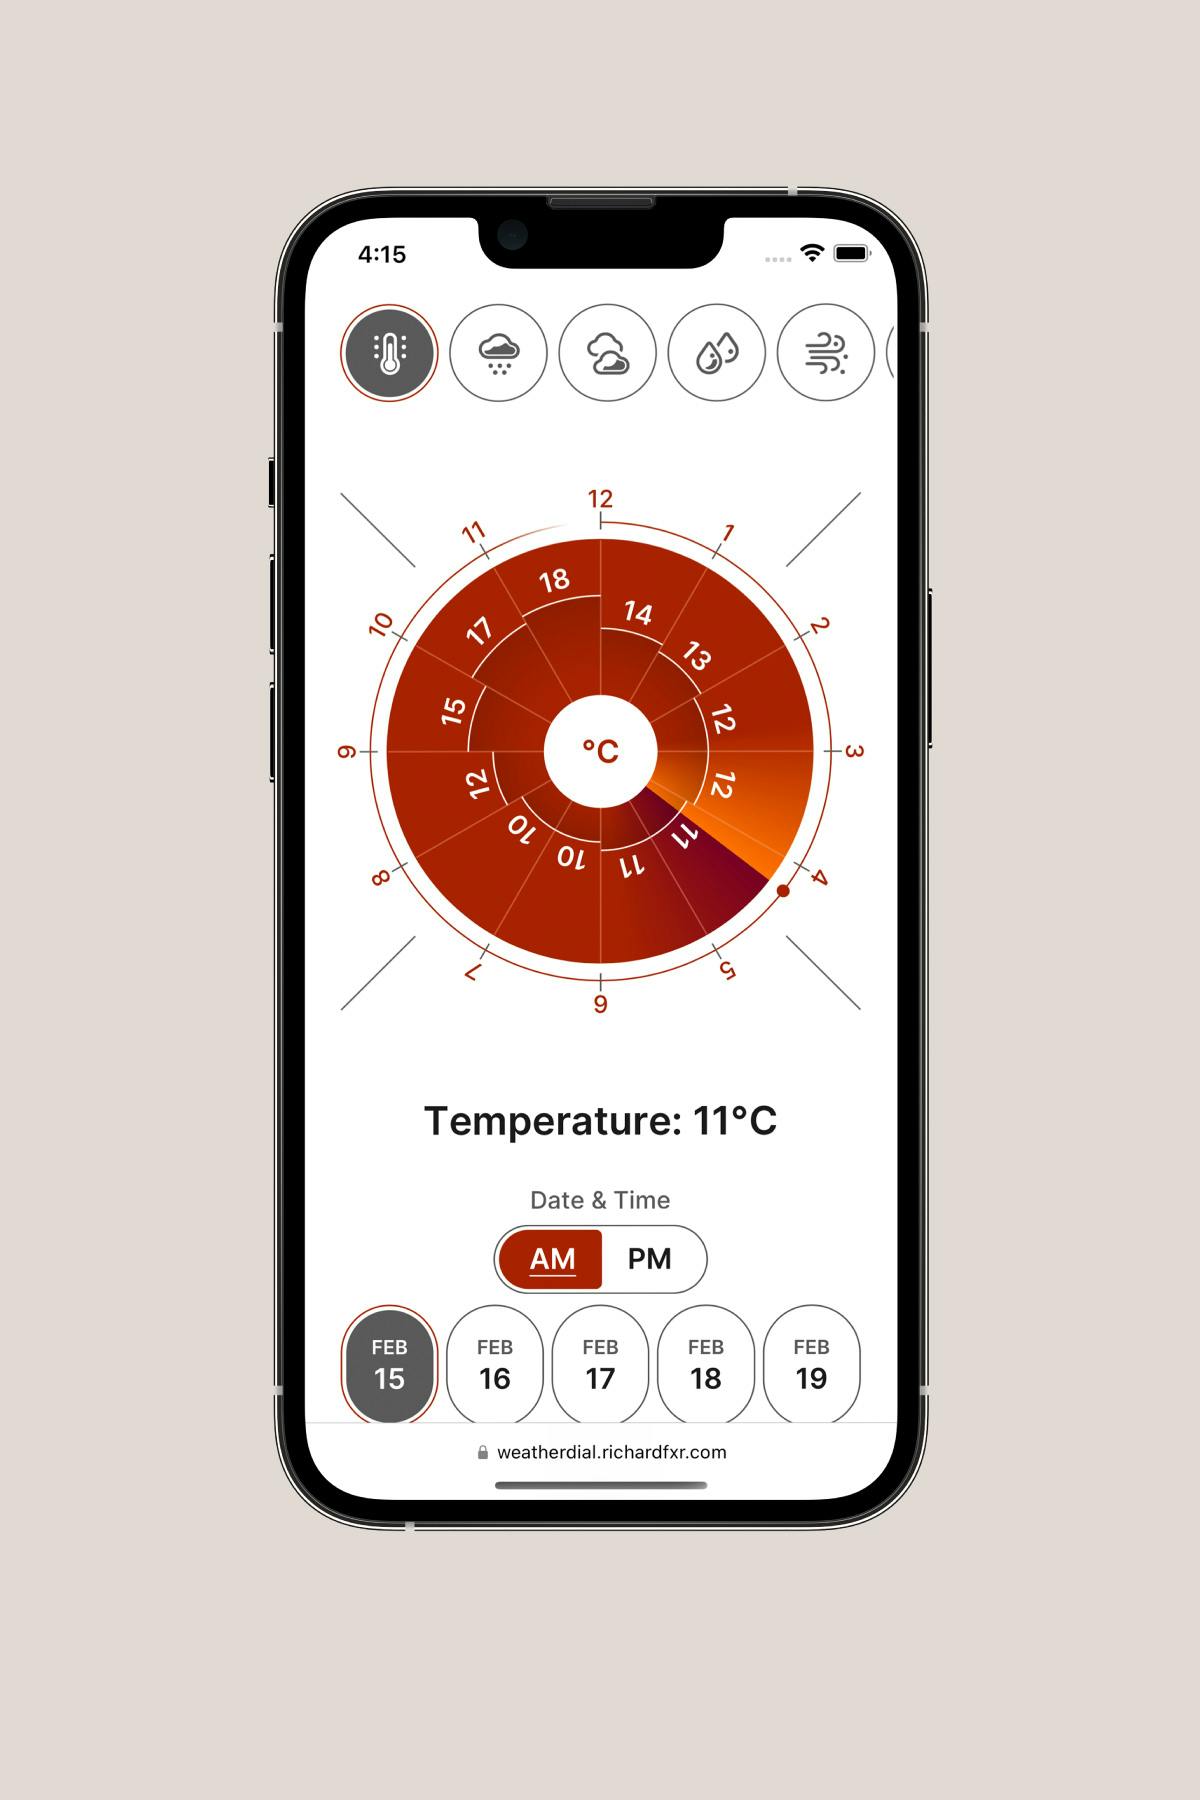
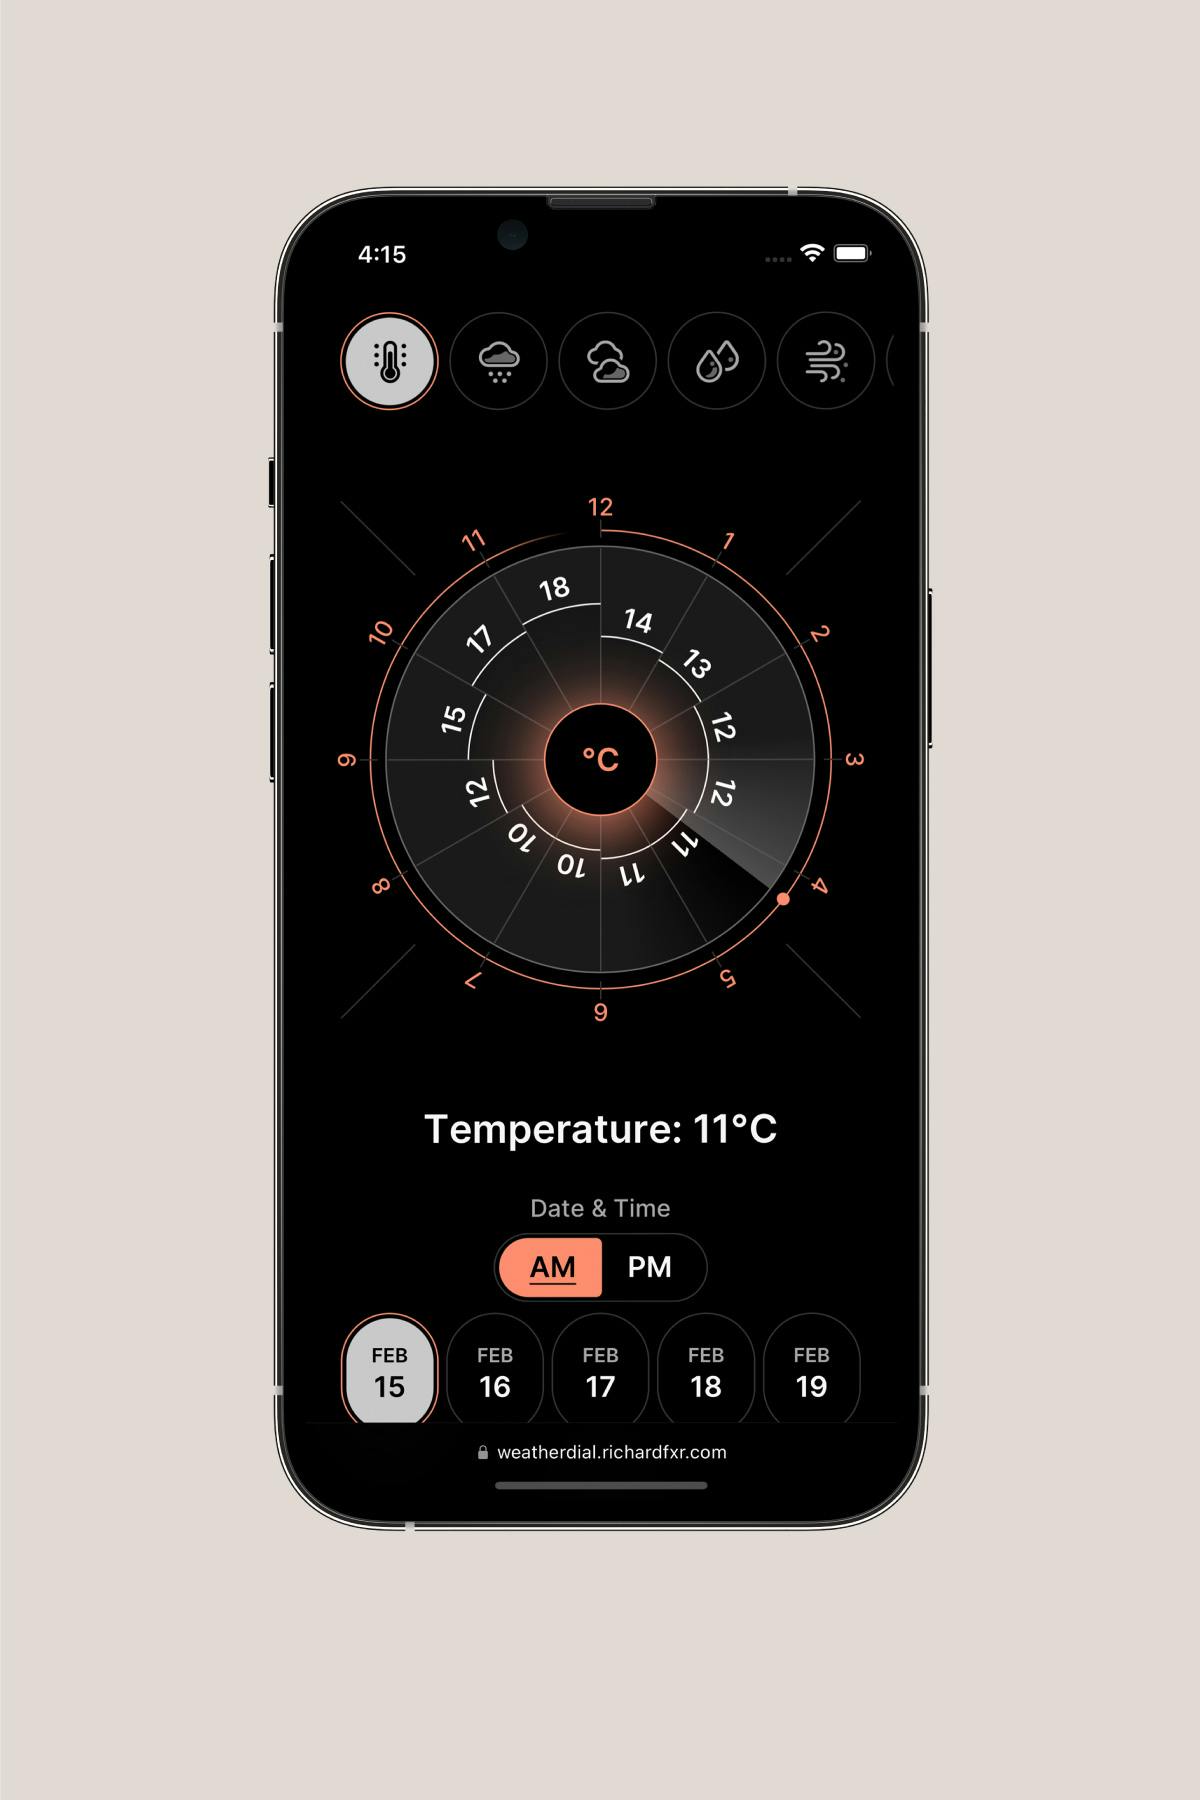
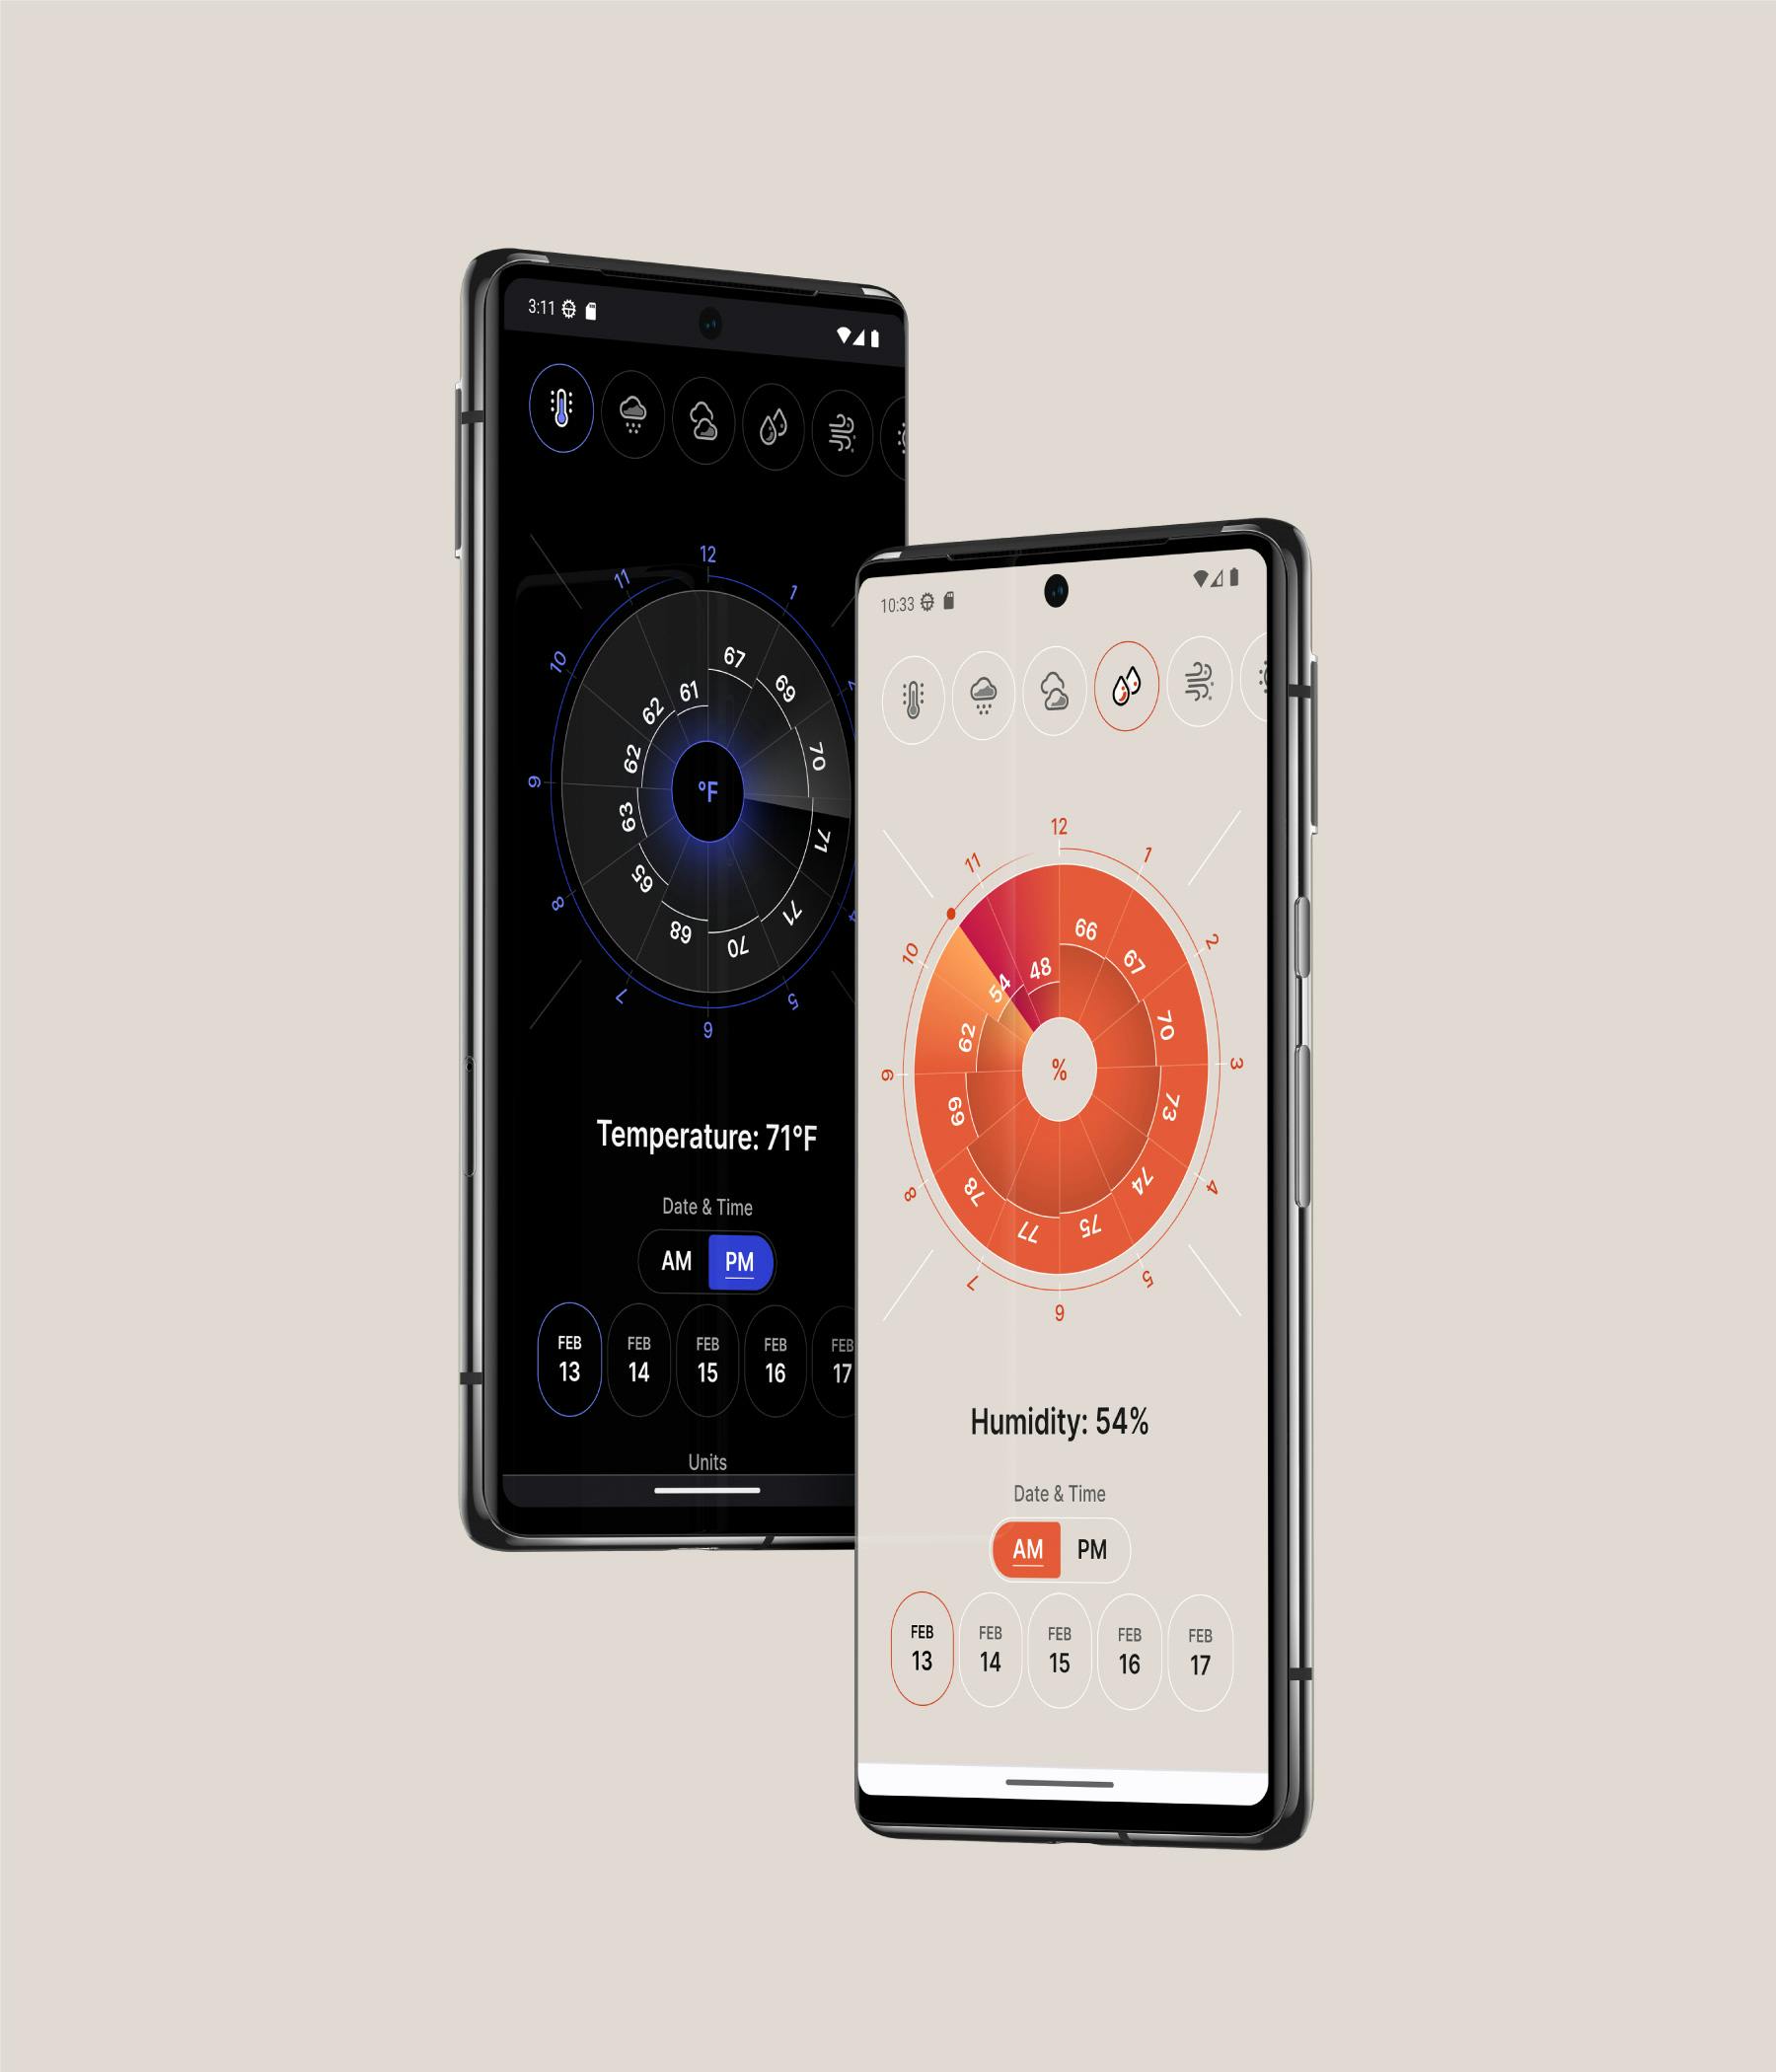
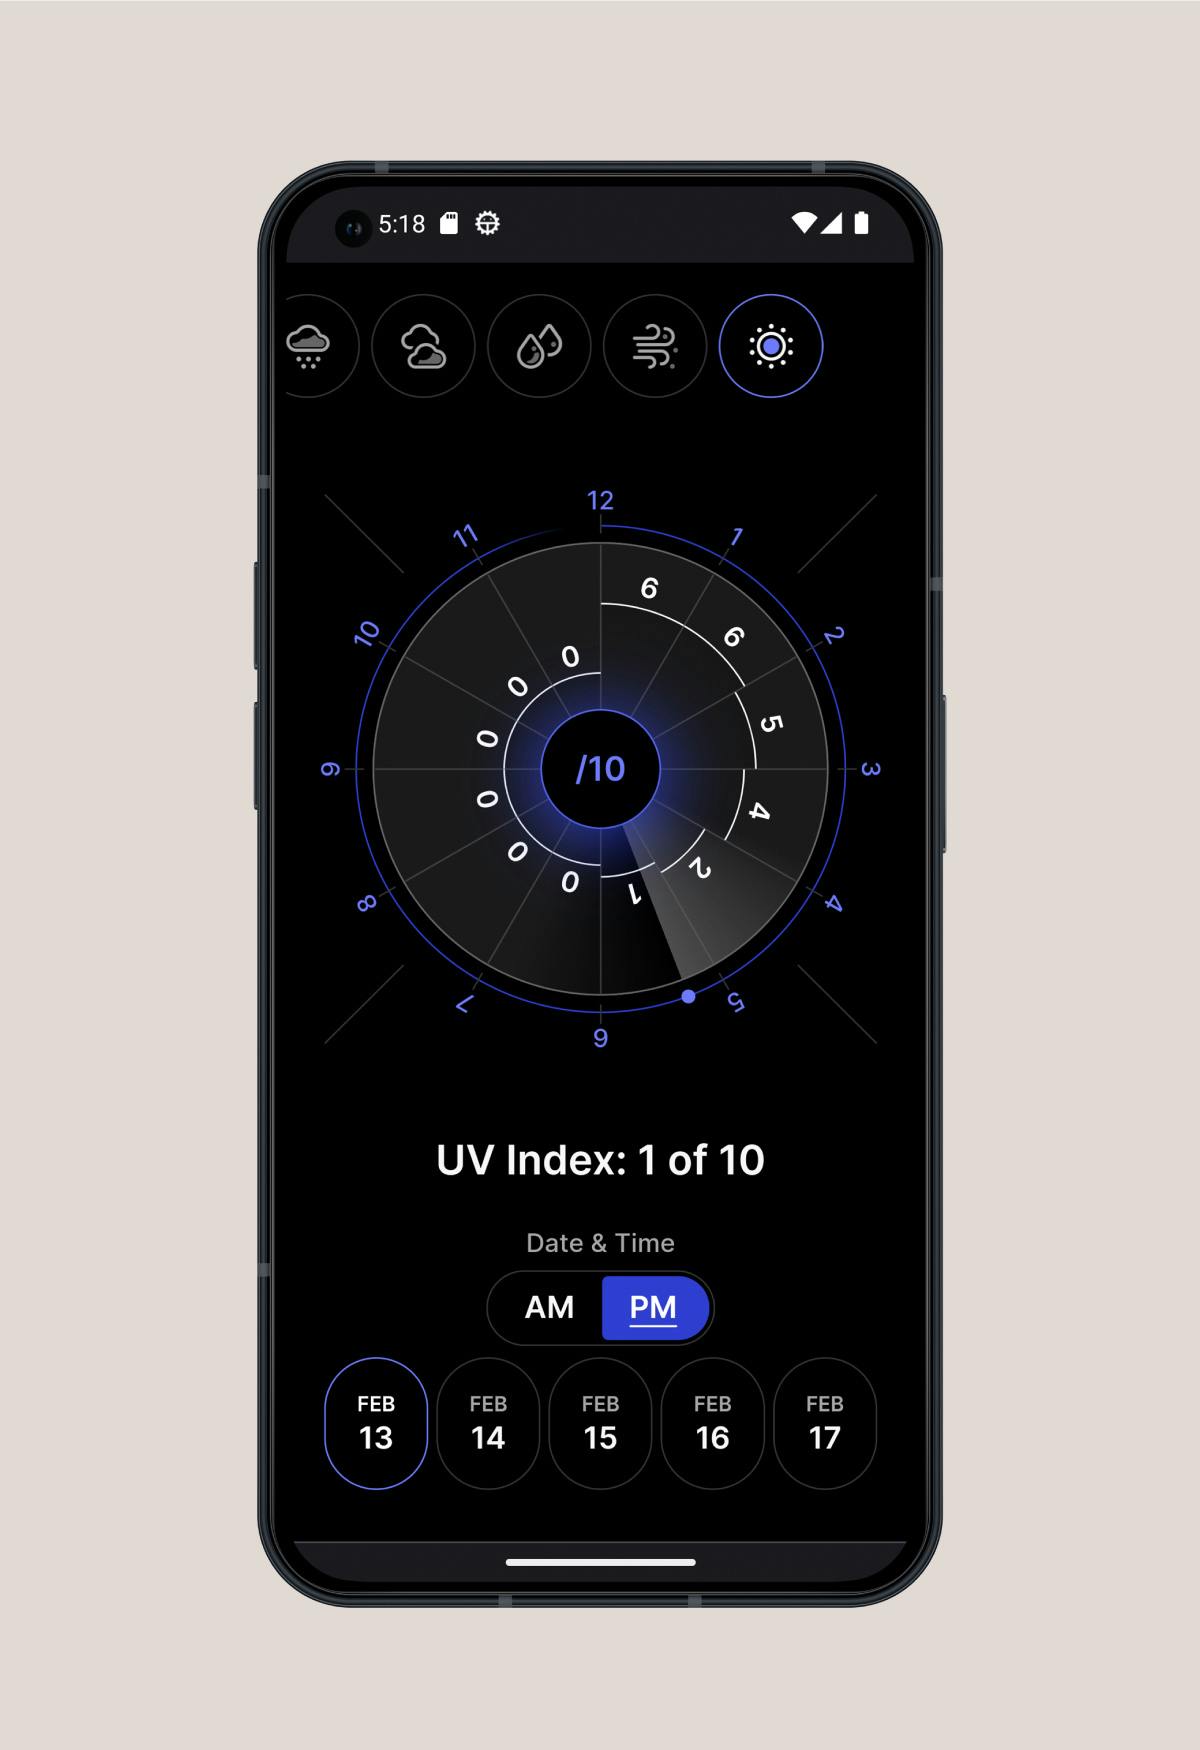
Weather Dial is a simple weather app that displays information in a circular barplot. The visualization is reminiscent of an analog clock, emphasizing the change in data over time. This new yet familiar display enables the user to understand the day's weather at a glance.
Visit Weather Dial- Date
- 2022-09
- Colors
- orange
- royal blue
- light gray
- Media
- UI/UX design
- development
Concept
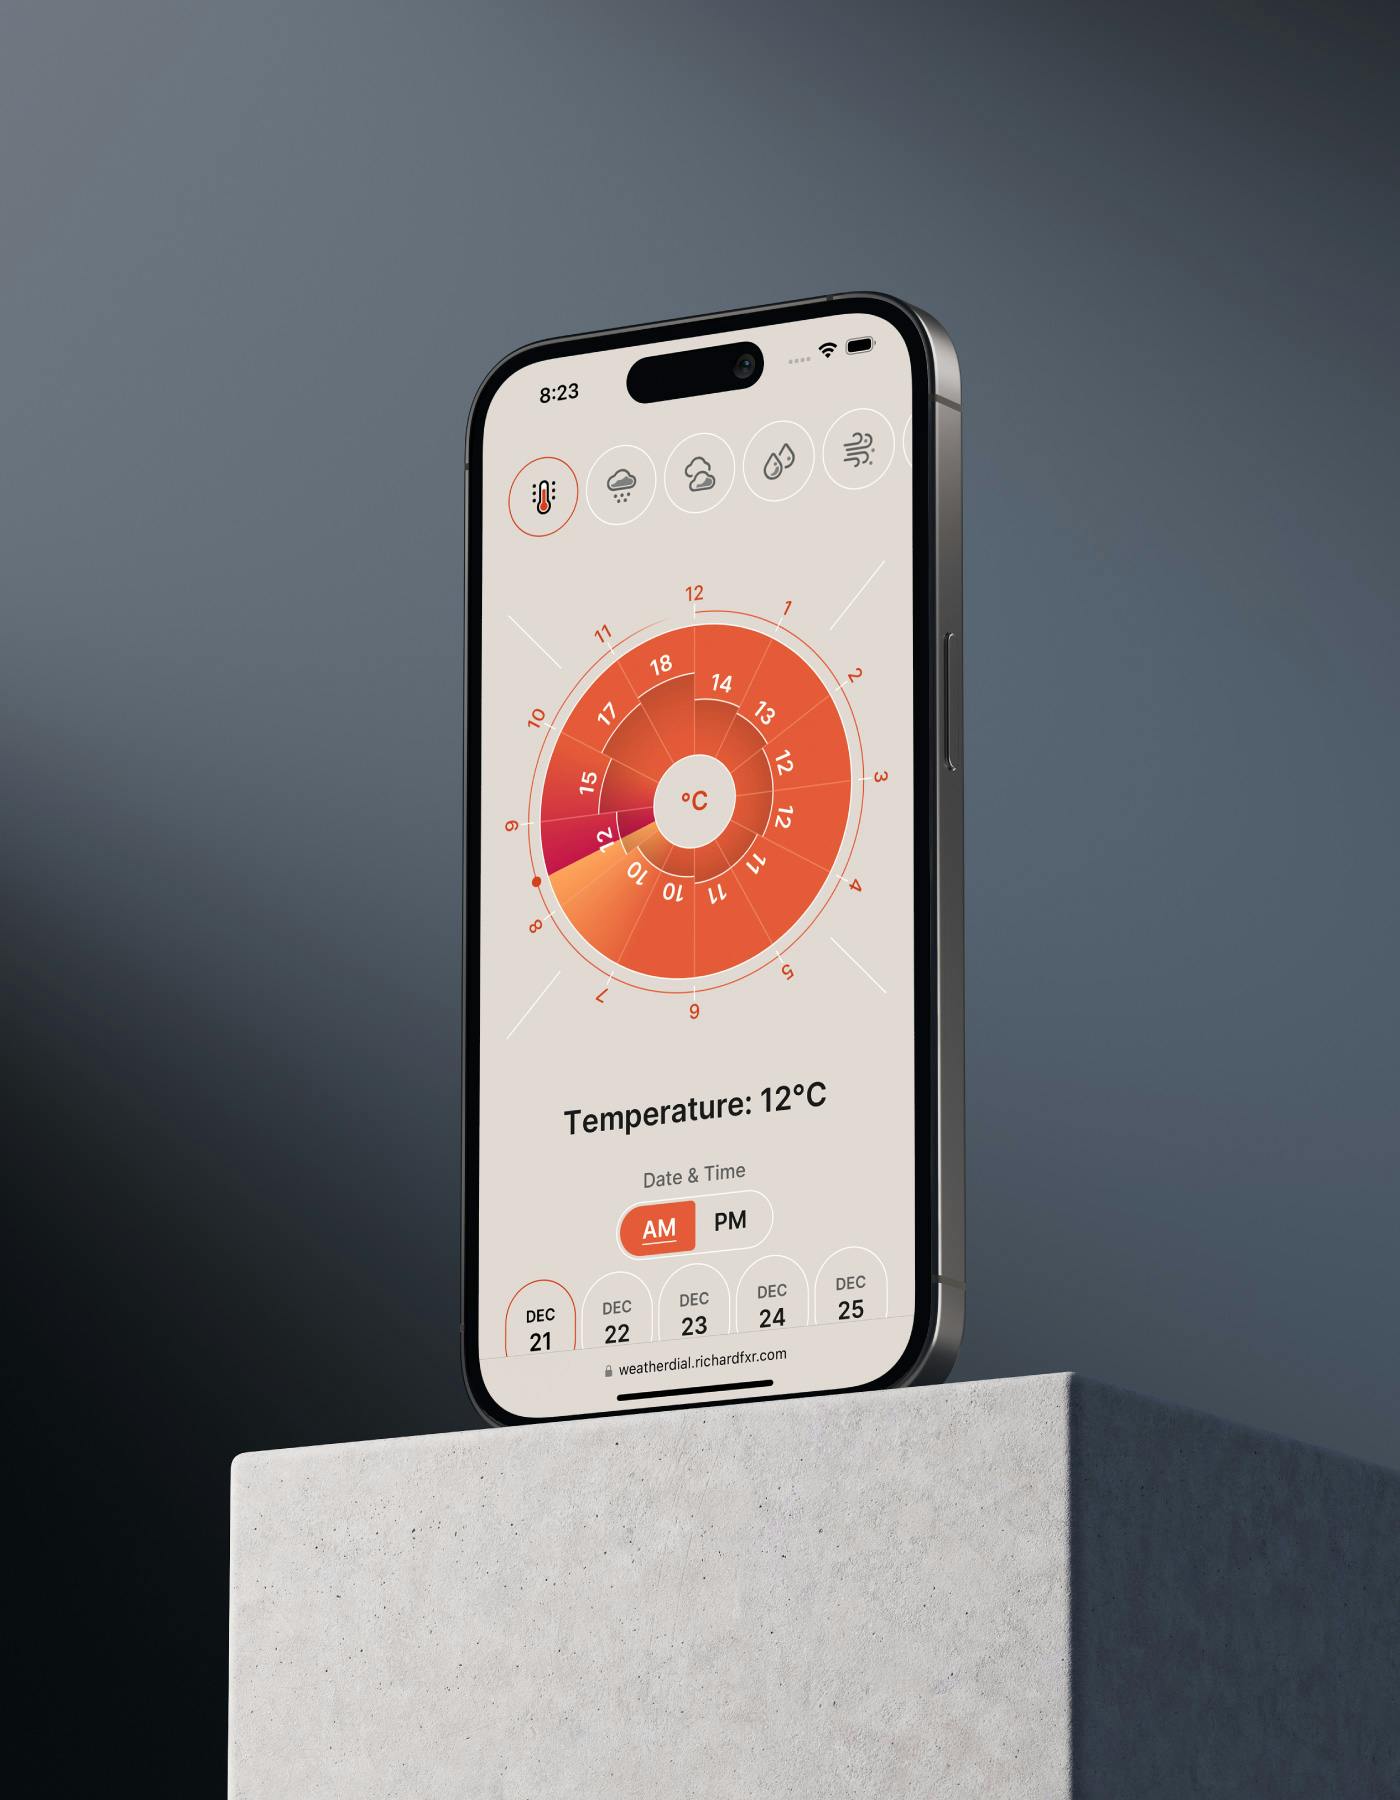
Most weather apps present temperatures in a line chart. The passage of time is not immediately obvious and the long charts result in horizontal scrolling on smaller devices.
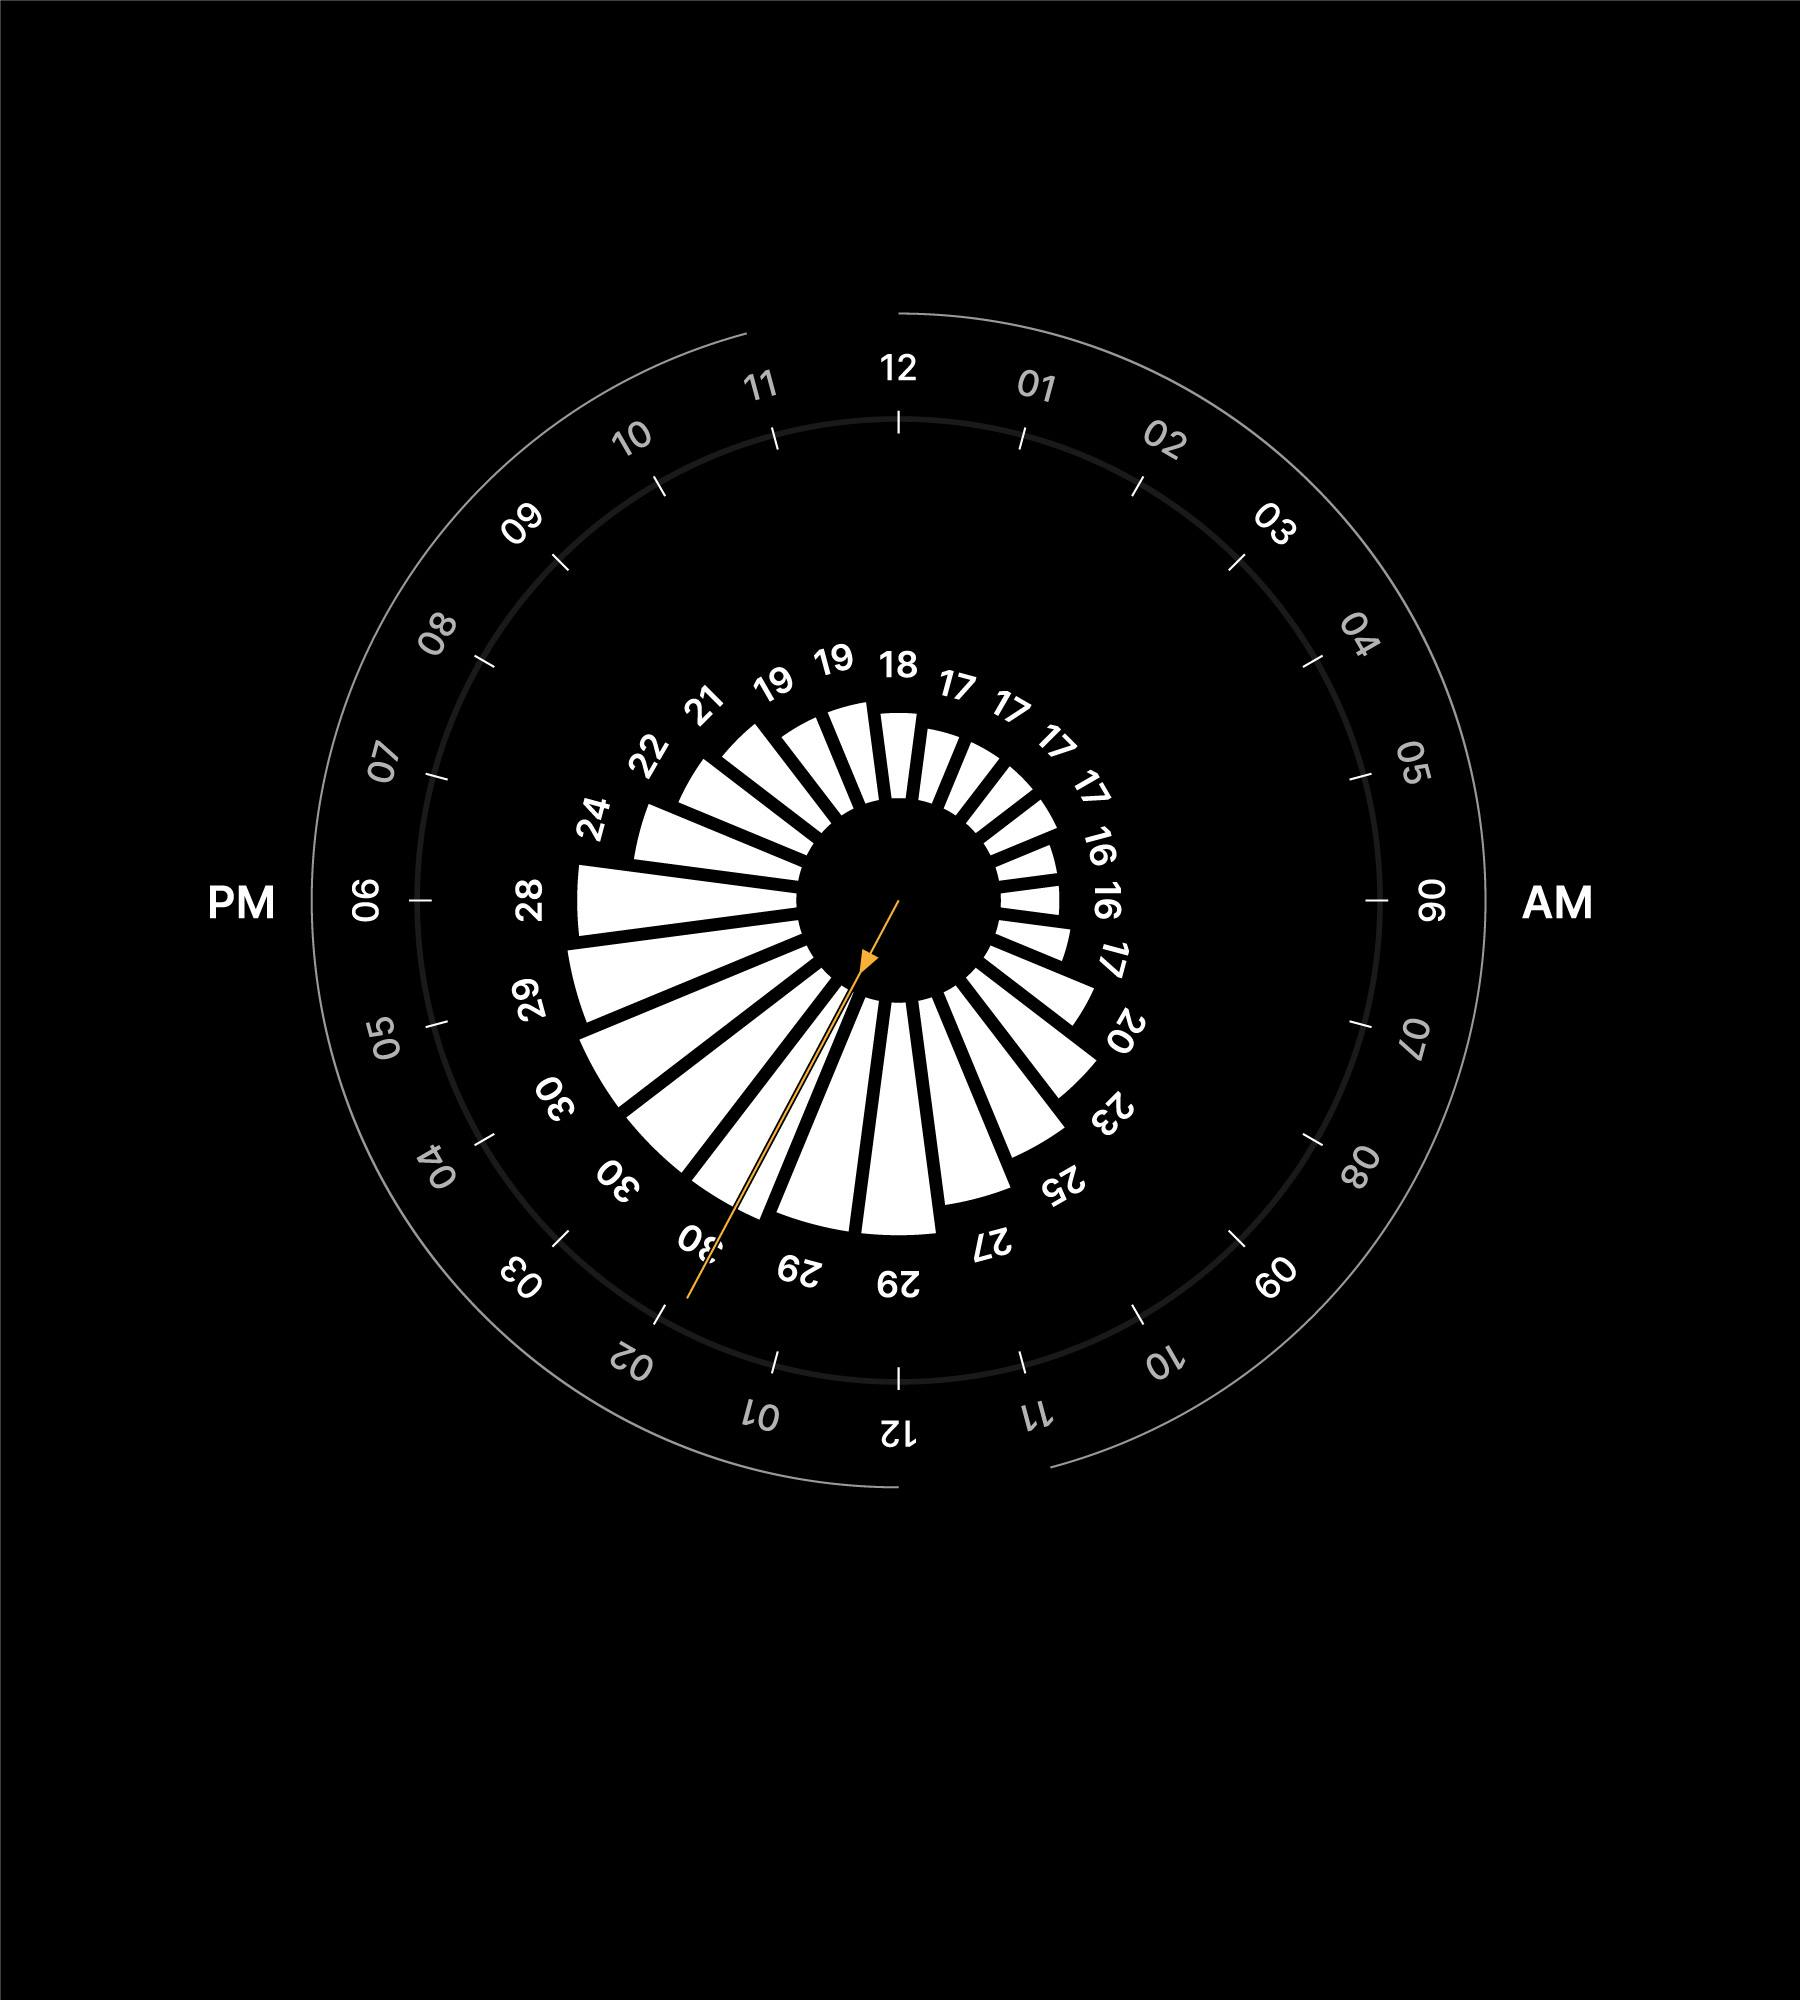
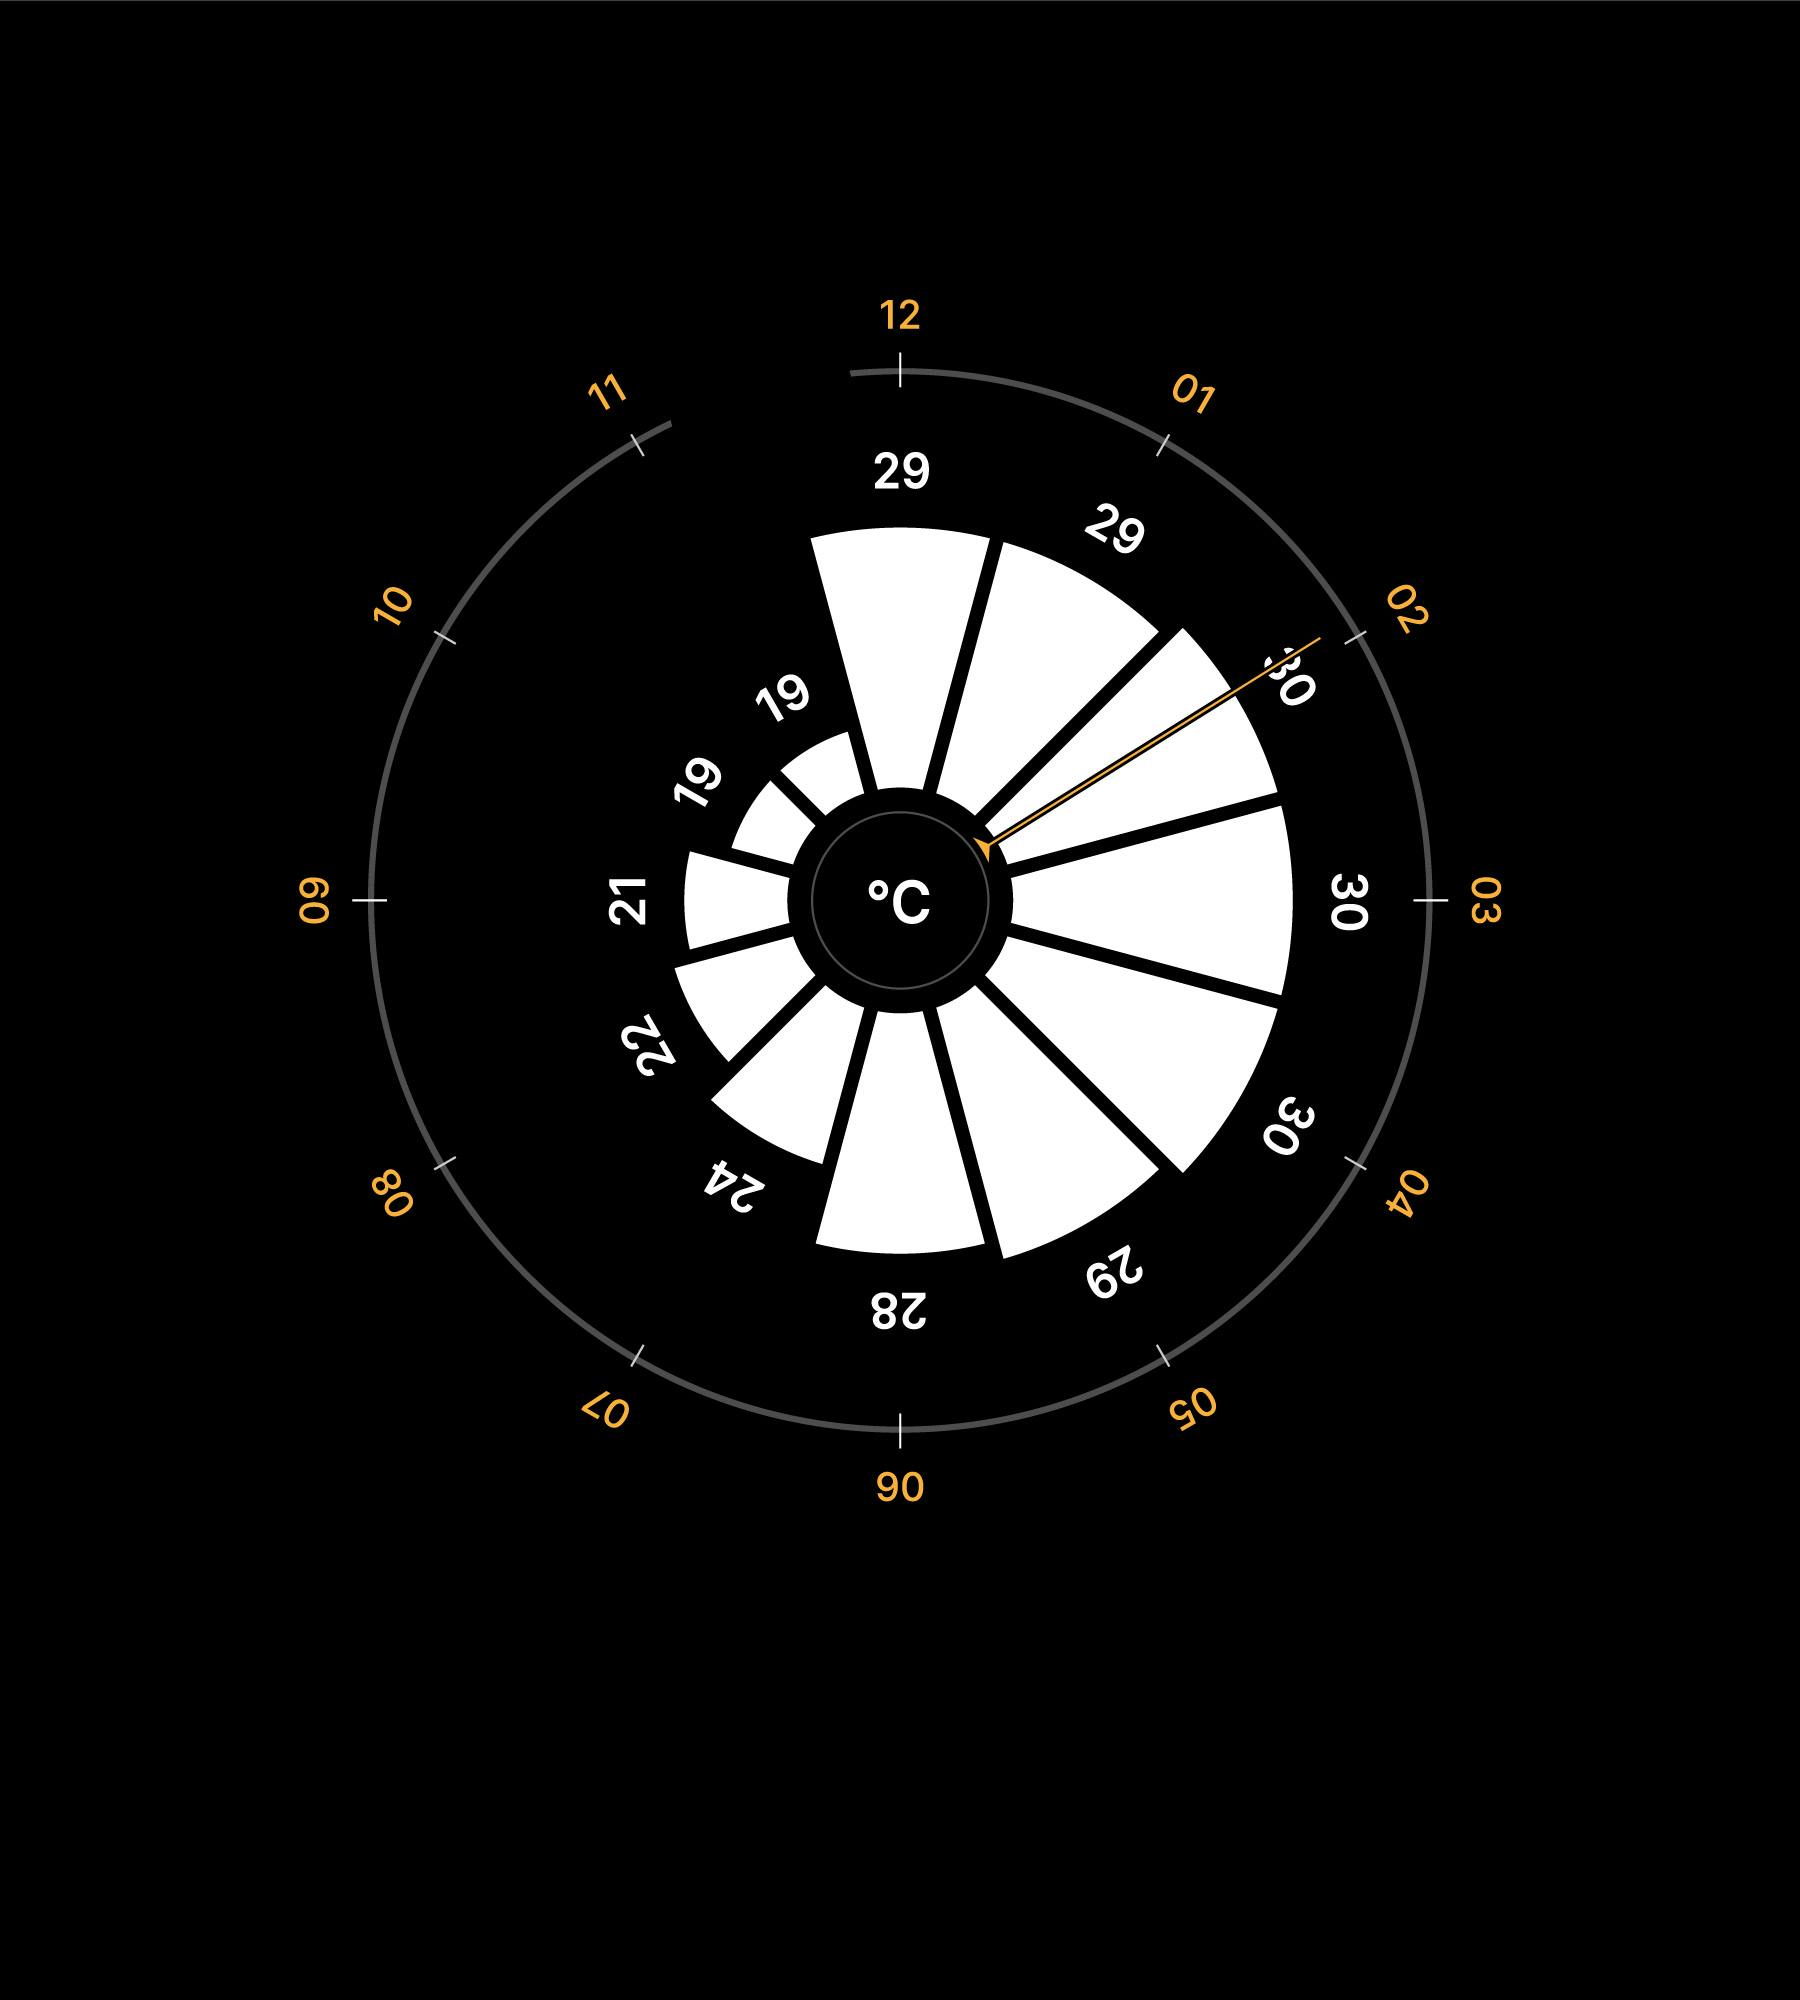
A 12-hour circular barplot mimics the layout of analog clocks, allowing for an intuitive sense of time. The circular graph is also more responsive, adapting to smaller screens without the need for scrolling.
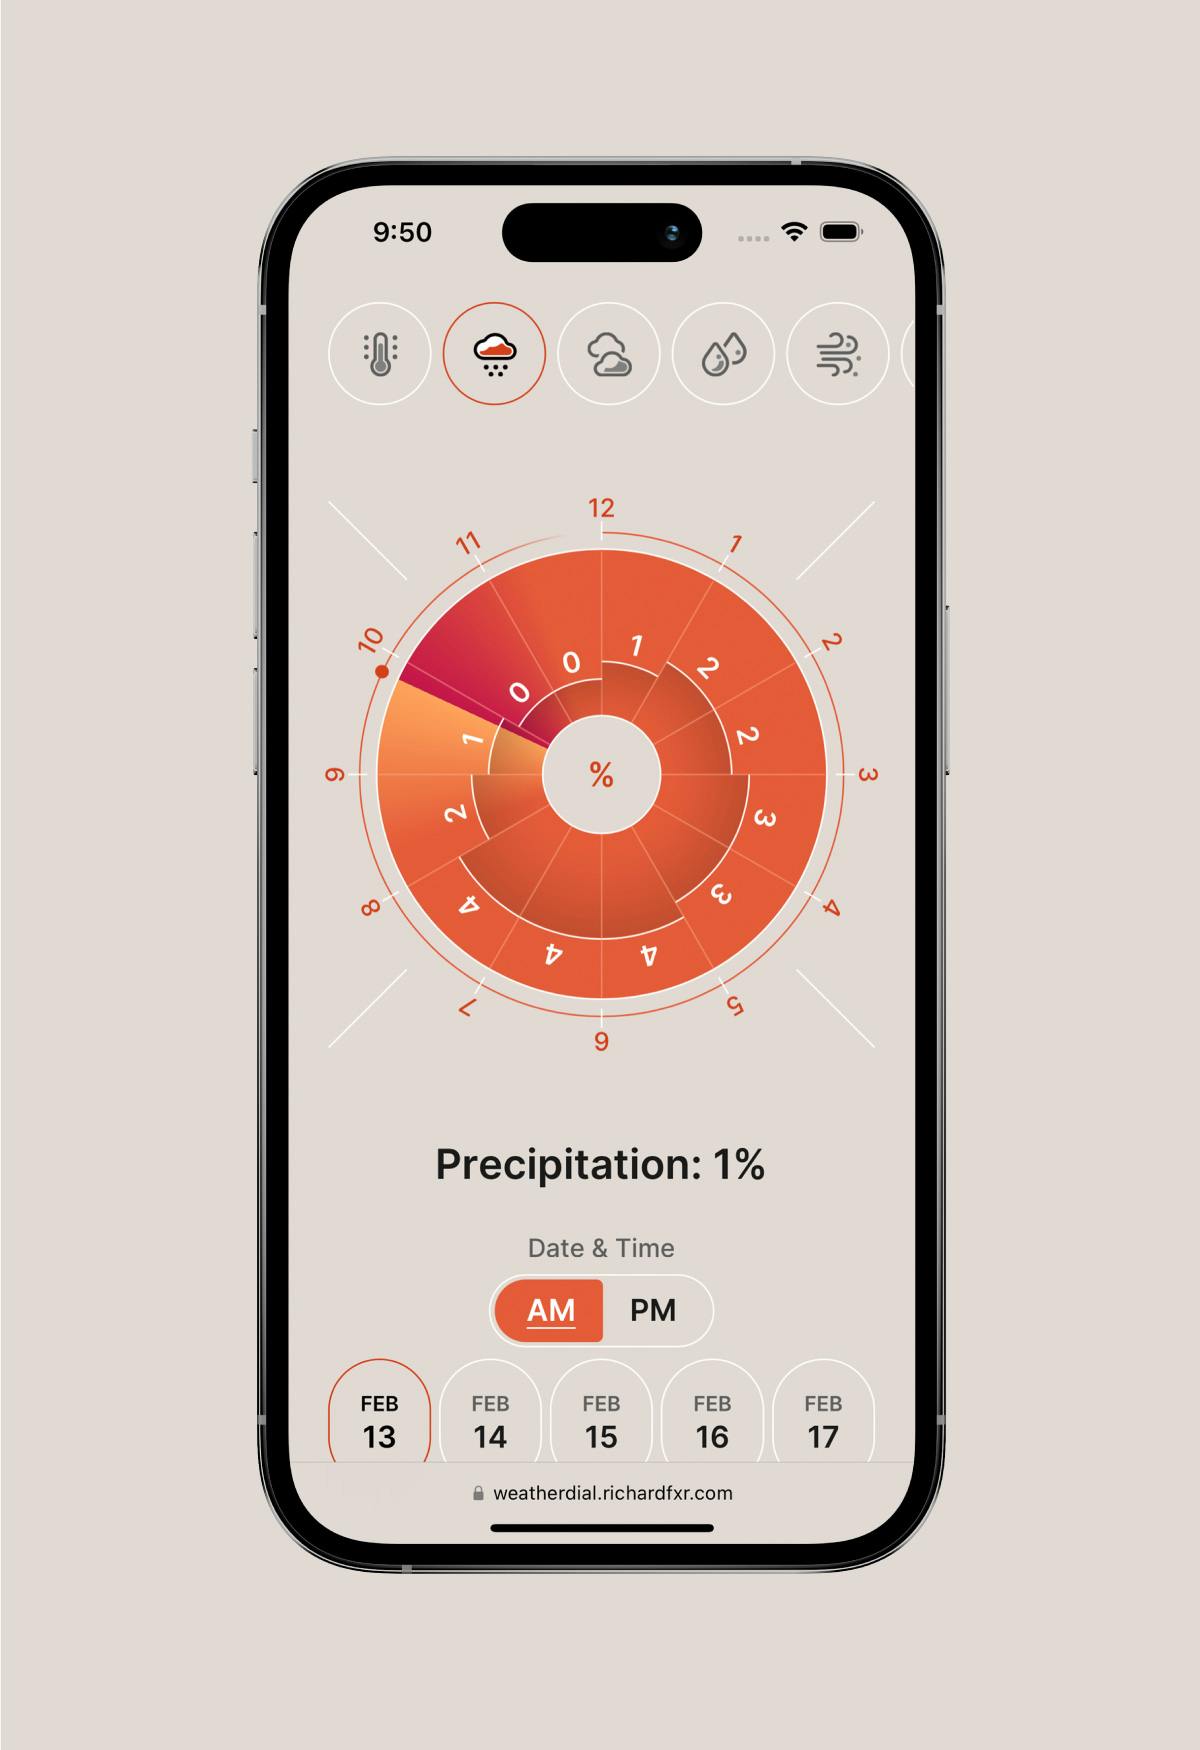
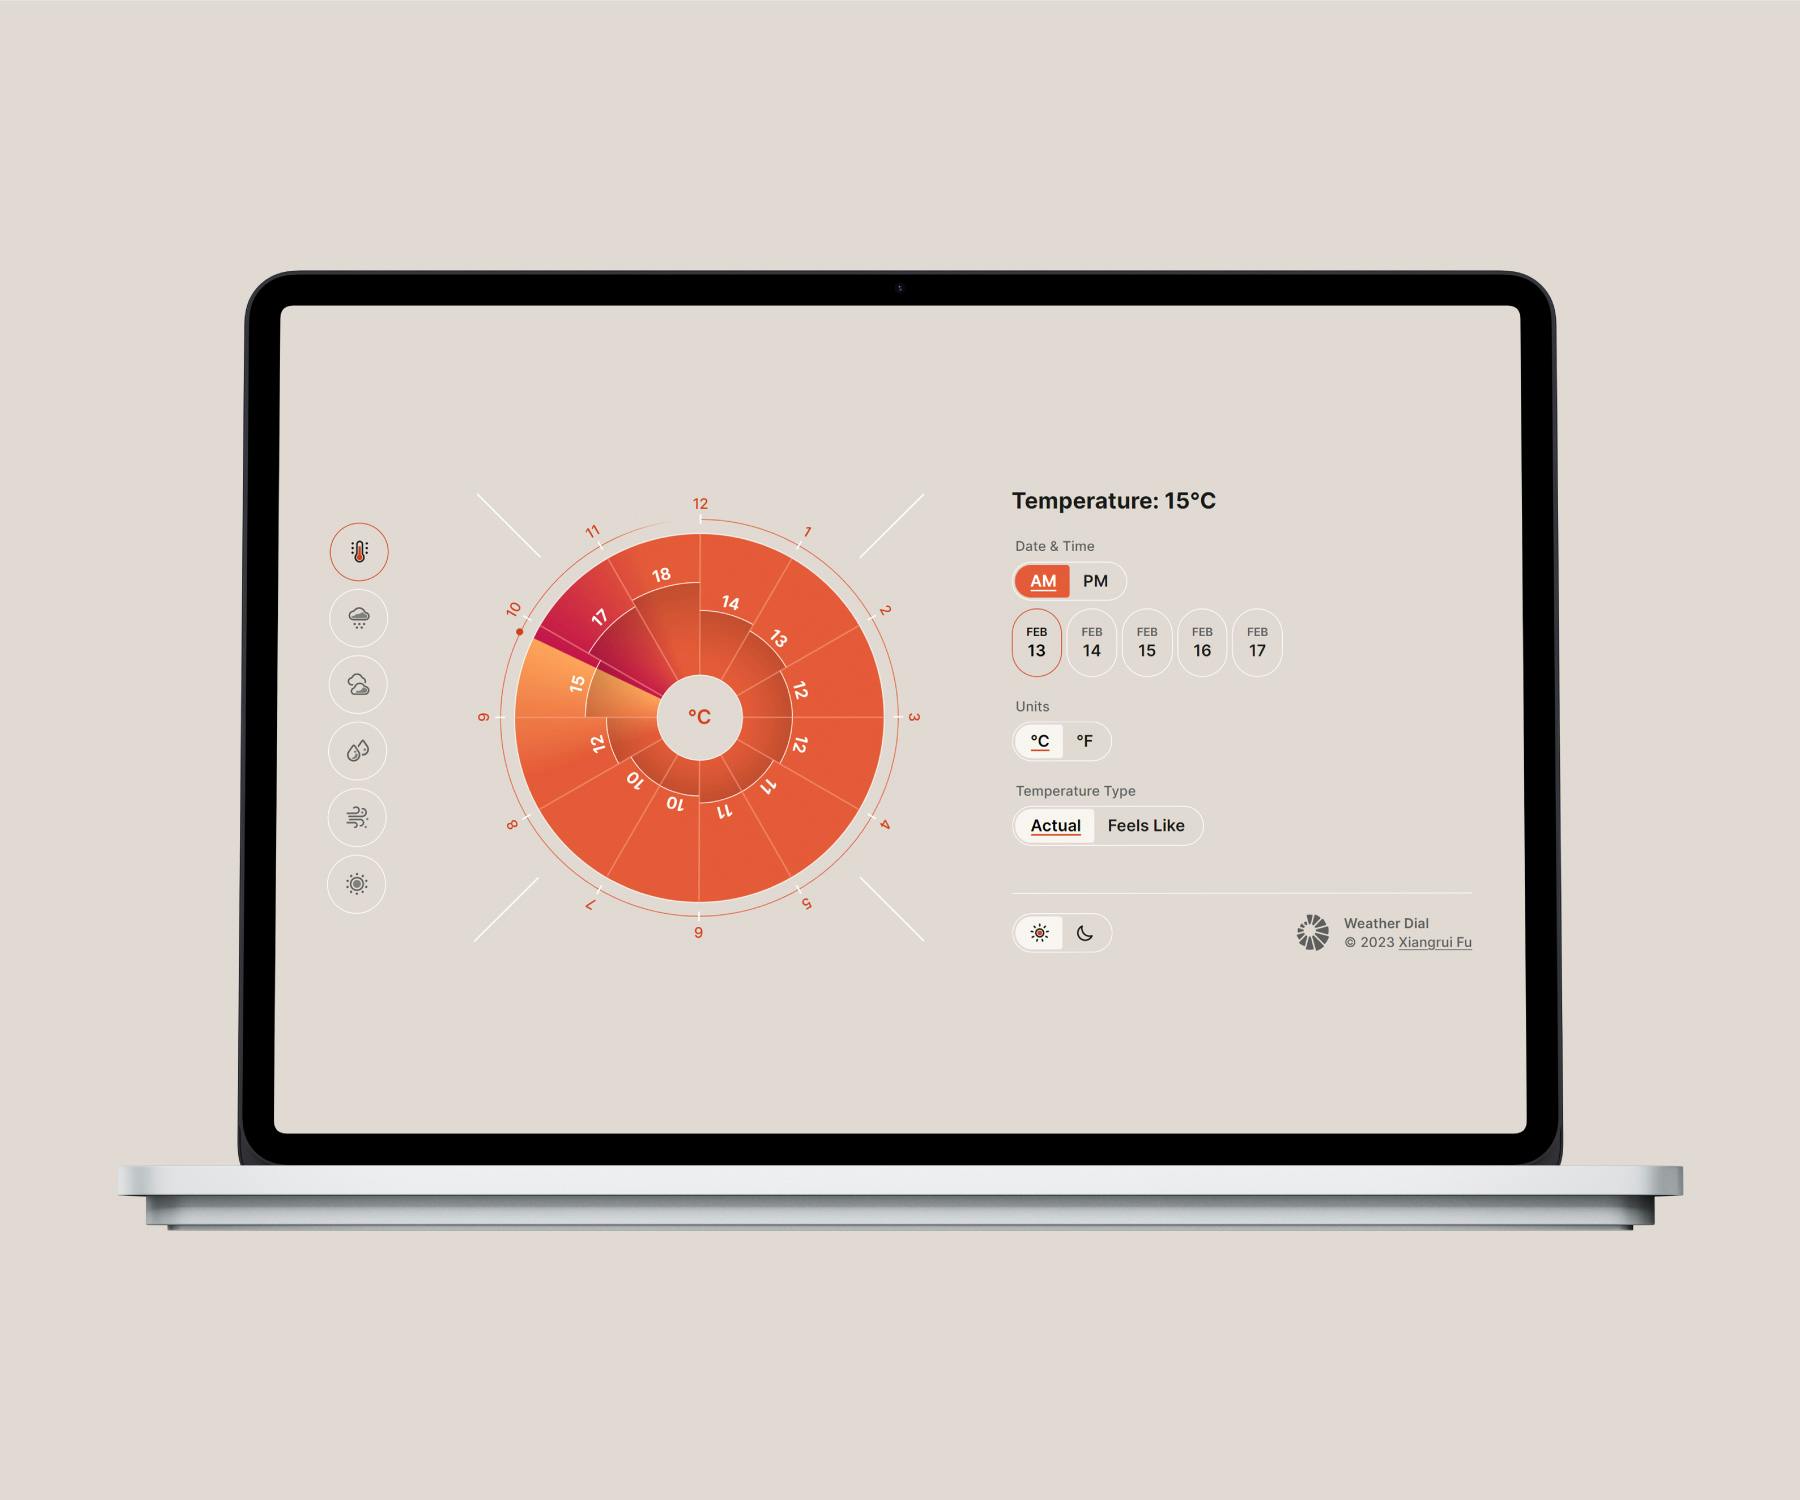
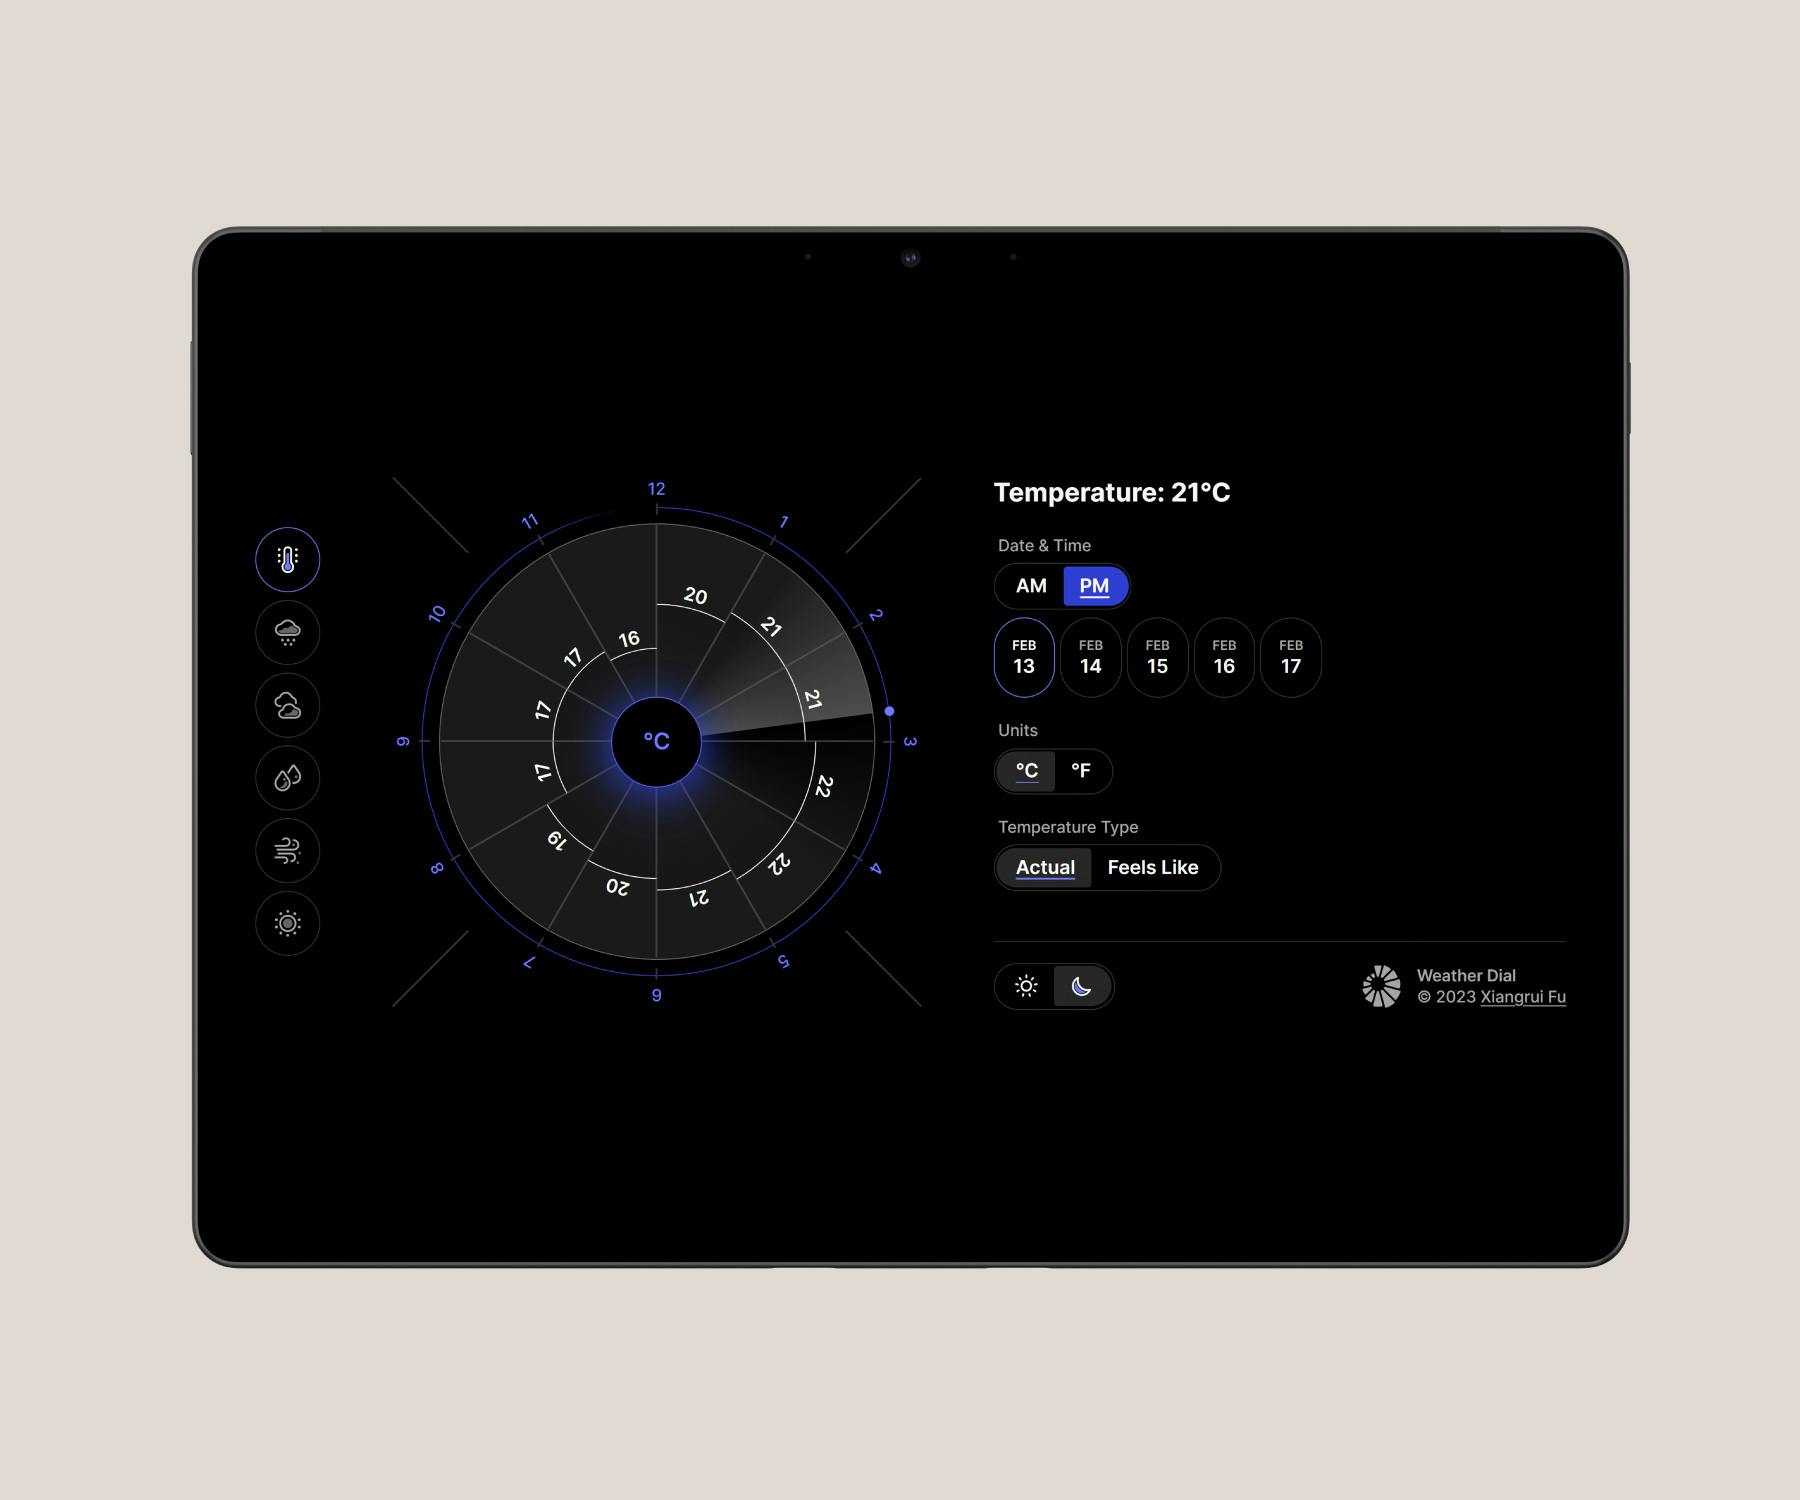
The design of Weather Dial is simple and clear. The interface is filled with fluid animations, giving a sense of ease that elevates the overall user experience.
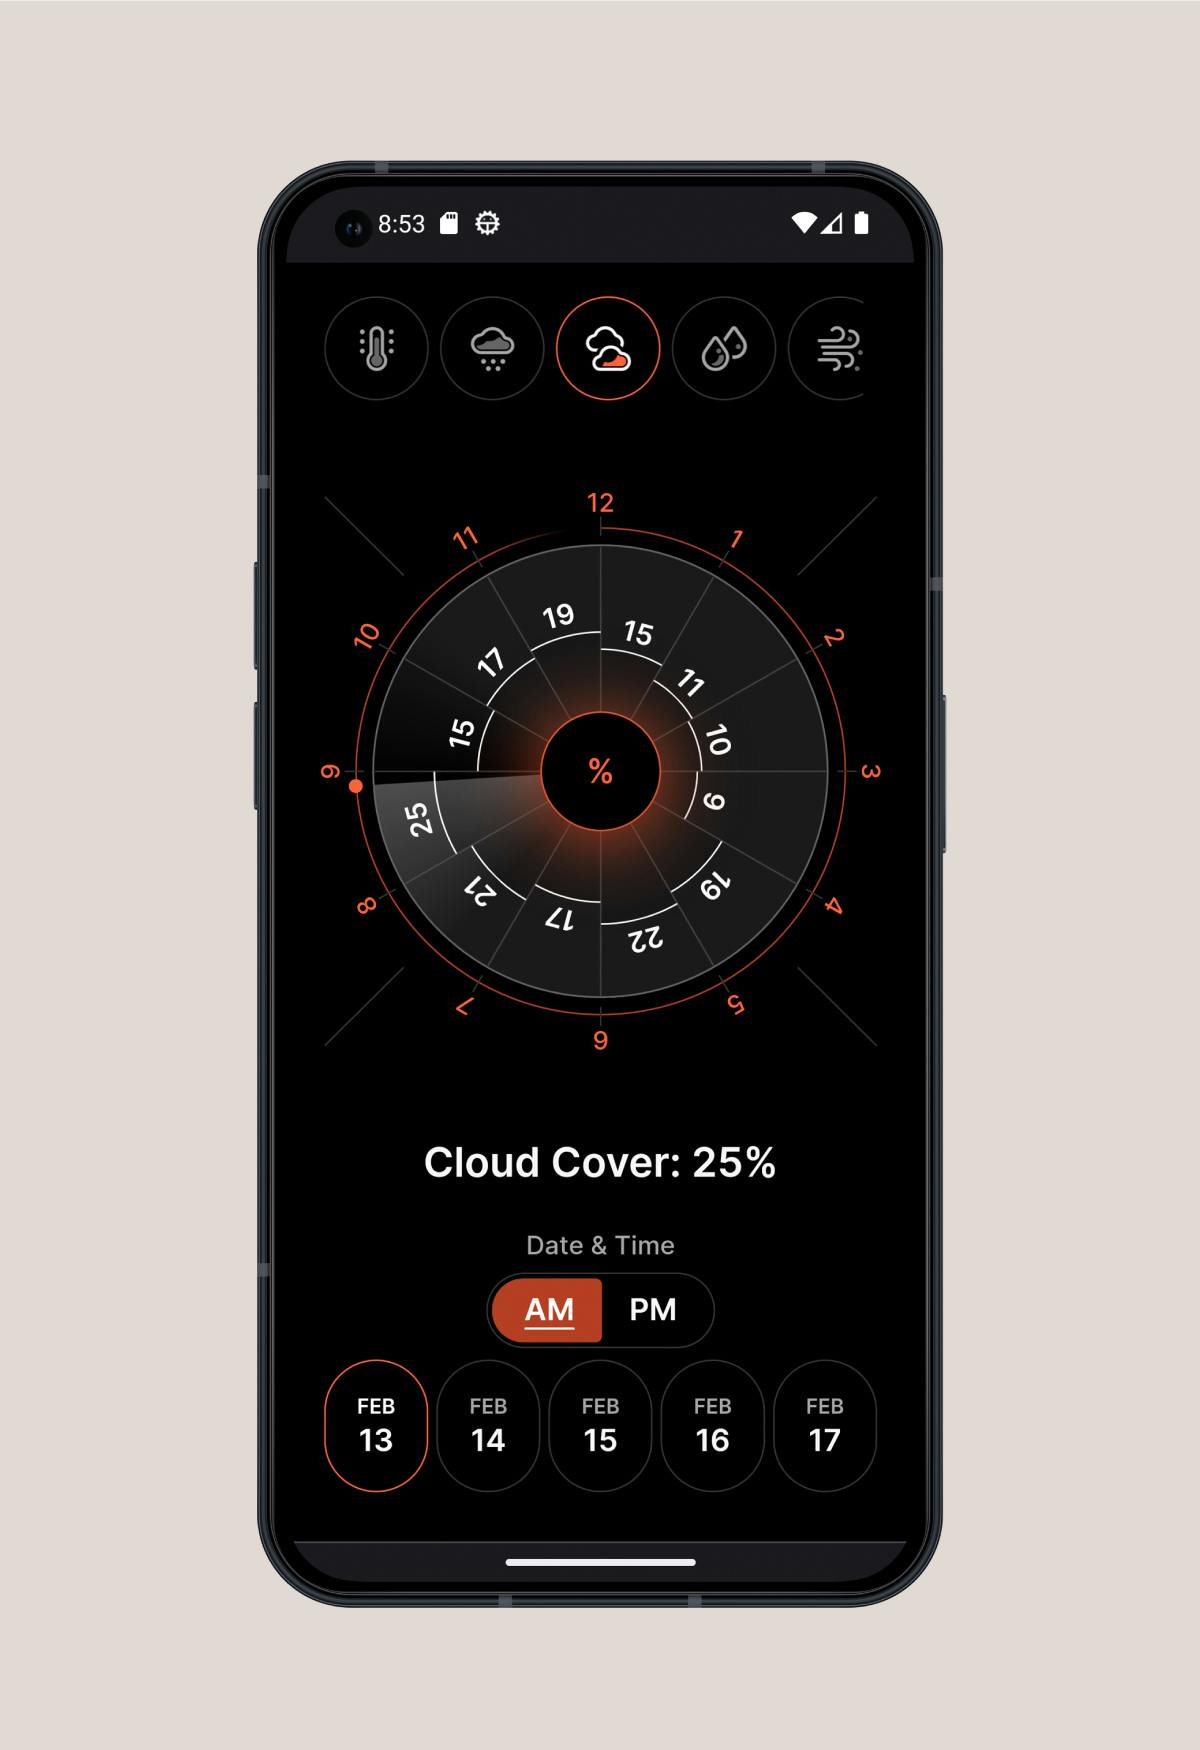
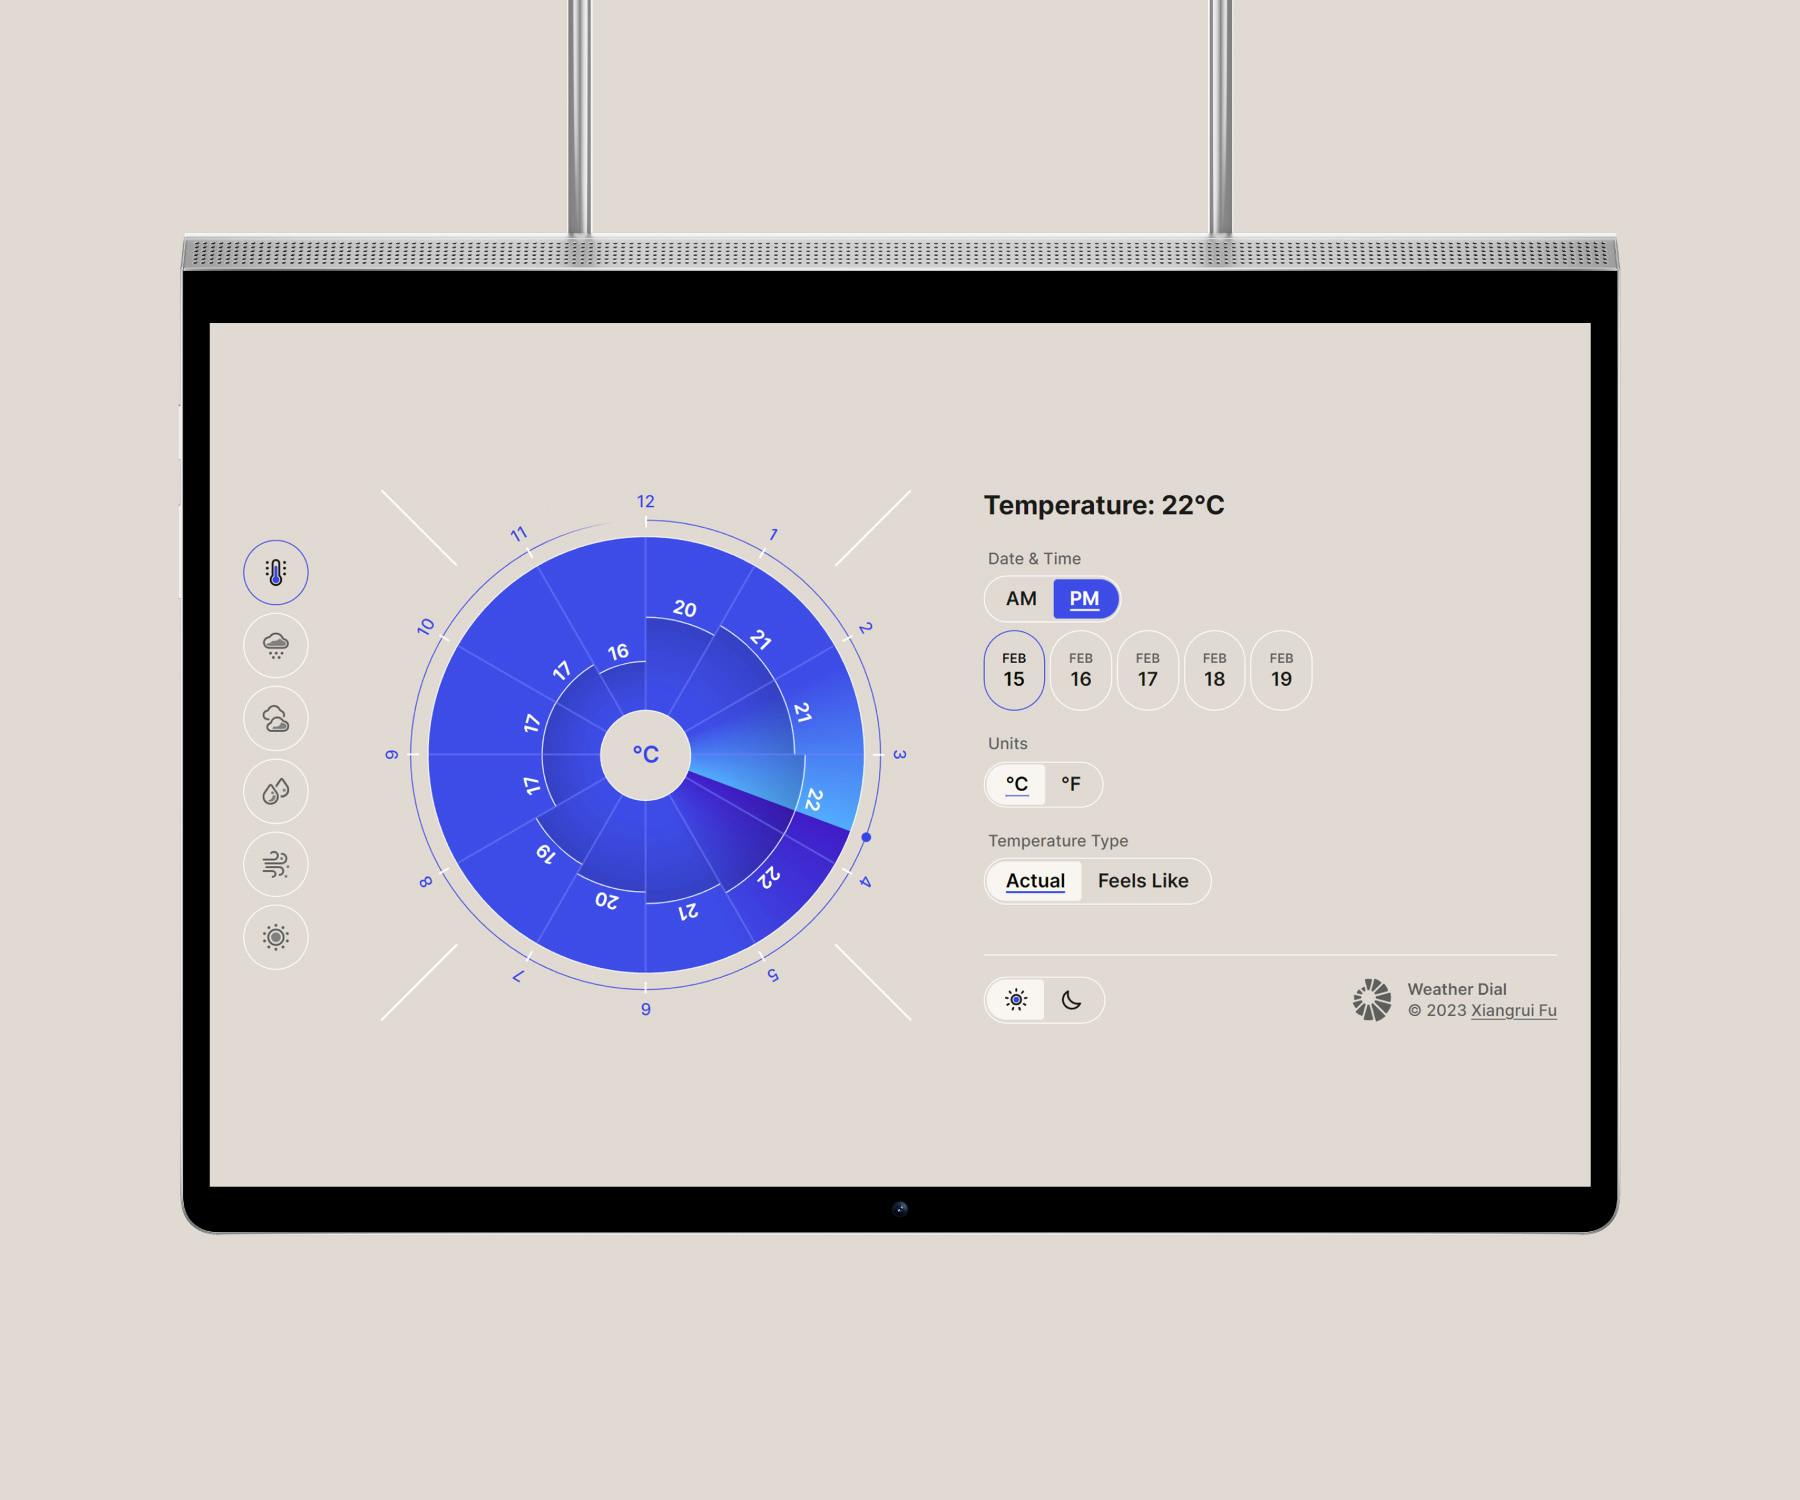
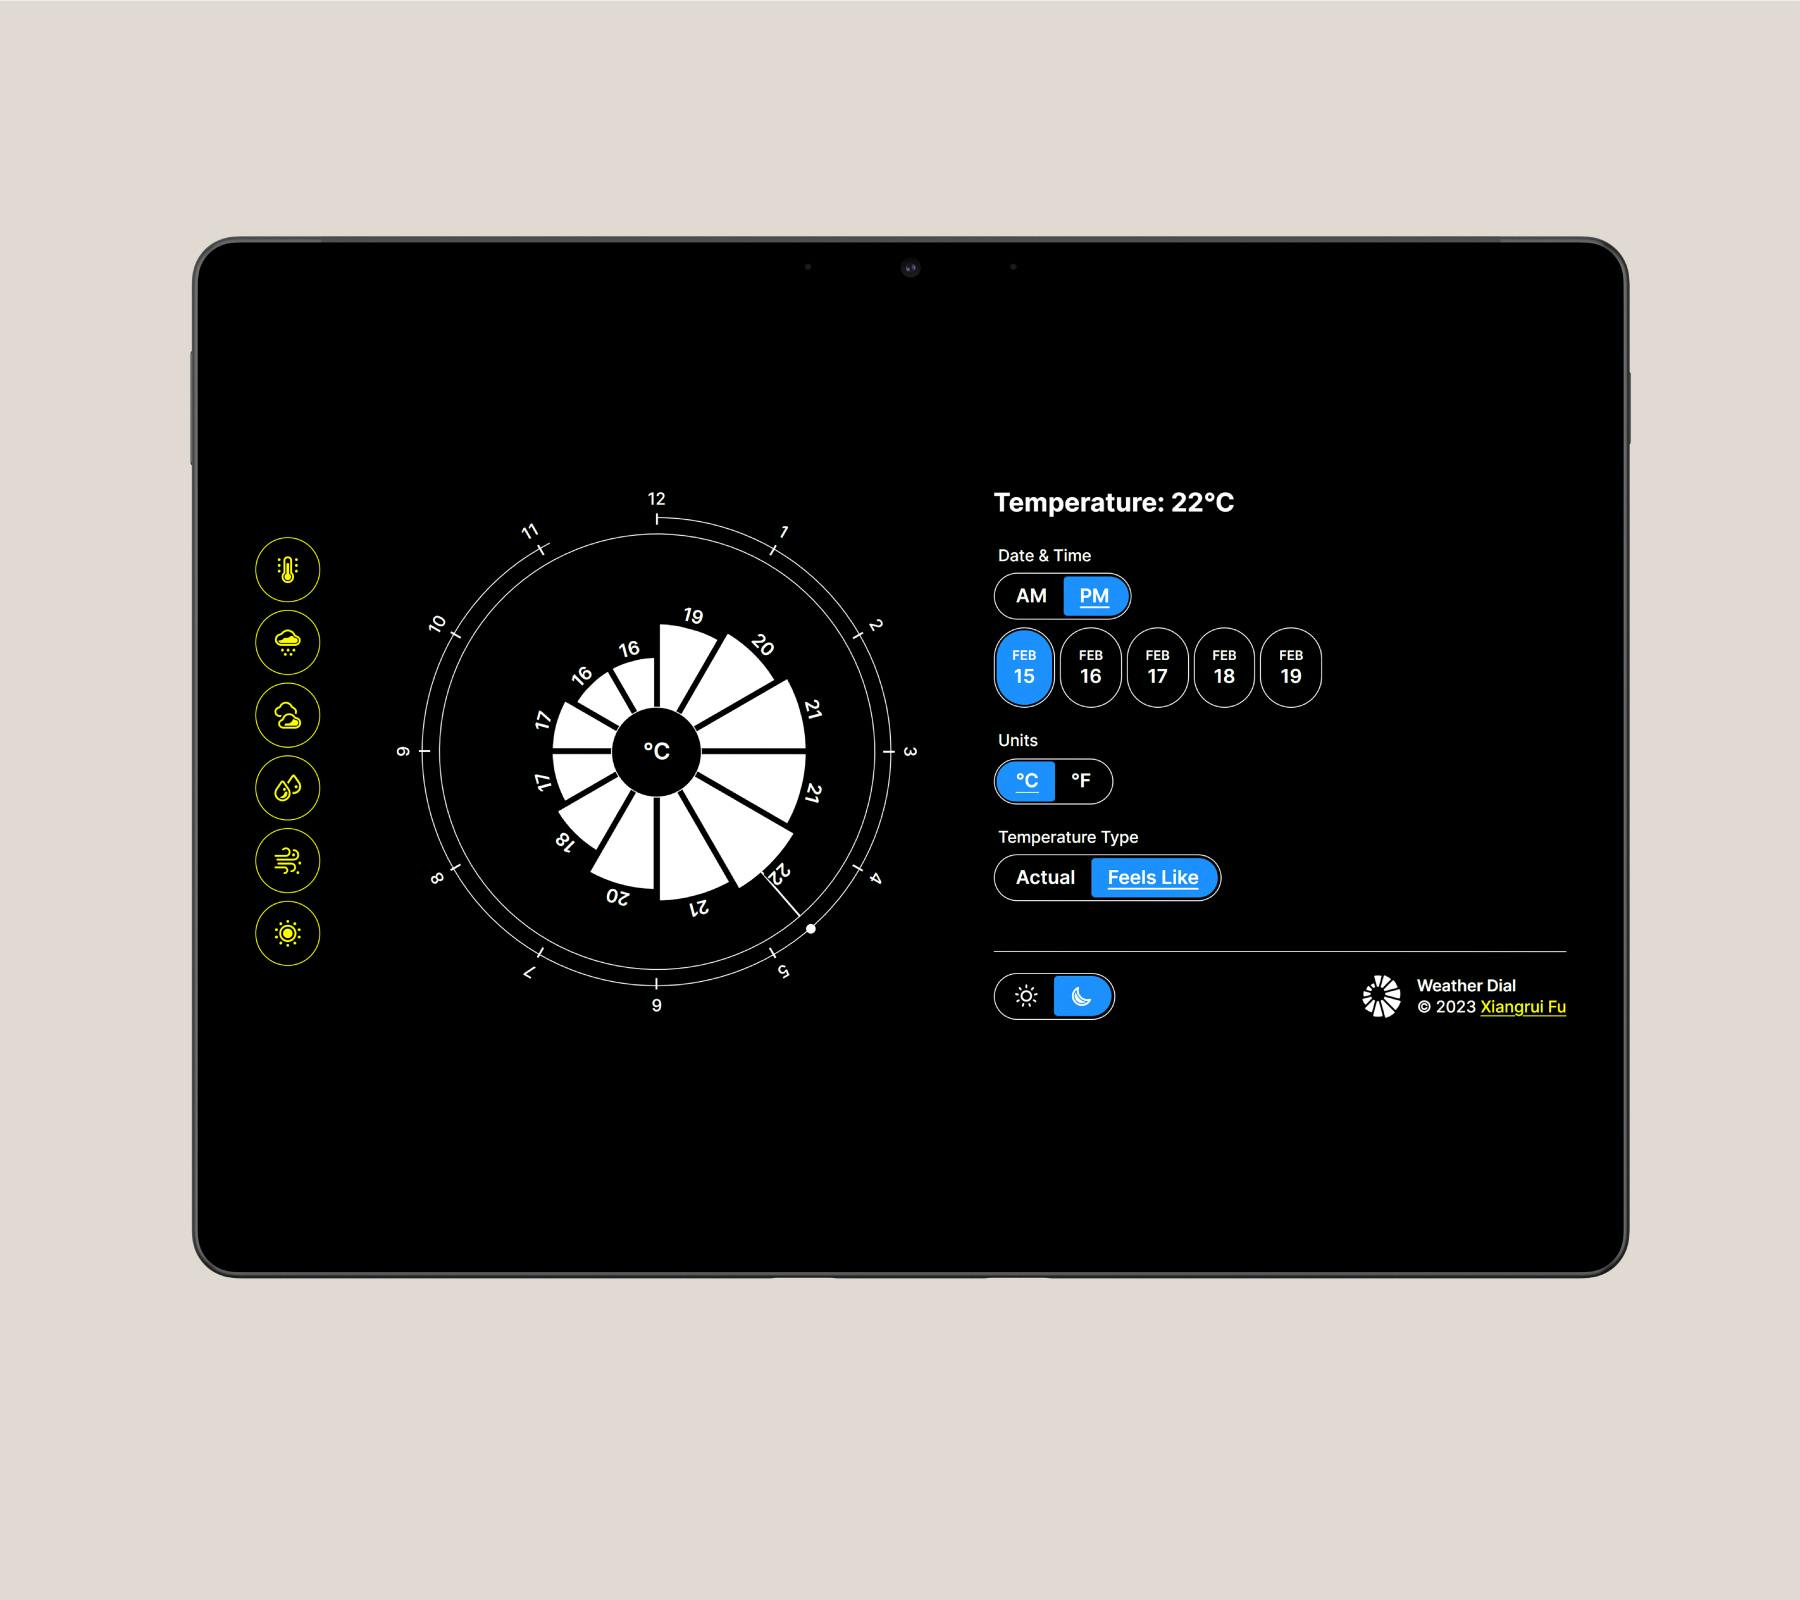
The circular barplot is semantically represented as a table to ensure the best compatibility with assistive technologies.
| Time | Temperature |
|---|---|
| 12 PM | 20 °C |
| 1 PM | 21 °C |
| 2 PM | 21 °C |
| 3 PM | 22 °C |
| 4 PM | 22 °C |
| 5 PM | 21 °C |
| 6 PM | 20 °C |
| 7 PM | 19 °C |
| 8 PM | 17 °C |
| 9 PM | 17 °C |
| 10 PM | 17 °C |
| 11 PM | 16 °C |
The interface also has high contrast and forced-colors styling, guaranteeing readability based on the user’s system settings.